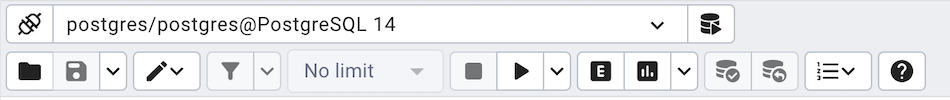
Query Tool Toolbar
The Query Tool toolbar uses context-sensitive icons that provide shortcuts to frequently performed tasks. If an icon is highlighted, the option is enabled; if the icon is grayed-out, the task is disabled.
Note
The Query Tool and View/Edit Data tools are actually different operating modes of the same tool. Some controls will be disabled in either mode.
Hover over an icon in pgAdmin to display a tooltip that describes the icon’s functionality.
File Options
Icon |
Behavior |
Shortcut |
|---|---|---|
Open File |
Click the Open File icon to display a previously saved query in the SQL Editor. |
Accesskey + O |
Save File |
Click the Save icon to perform a quick-save of a previously saved query, or to access the Save menu:
|
Accesskey + S |
Filter/Limit Options
Icon |
Behavior |
Shortcut |
|---|---|---|
Filter |
Click the Filter icon to set filtering and sorting criteria for the data when in View/Edit data mode. Click the down arrow to access other filtering and sorting options:
|
Accesskey + F |
Limit Selector |
Select a value in the Limit Selector to limit the size of the dataset to a number of rows. |
Accesskey + R |
Query Editing Options
Icon |
Behavior |
Shortcut |
|---|---|---|
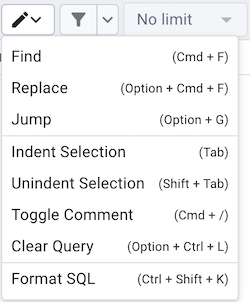
Edit |
Use the Edit menu to search, replace, or navigate the code displayed in the SQL Editor: |
|
Select Find to provide a search target, and search the SQL Editor contents. |
Cmd+F |
|
Select Replace to locate and replace (with prompting) individual occurrences of the target. |
Option+Cmd+F (MAC) Ctrl+Shift+F (Others) |
|
Select Jump to navigate to the next occurrence of the search target. |
Alt+G |
|
Select Indent Selection to indent the currently selected text. |
Tab |
|
Select Unindent Selection to remove indentation from the currently selected text. |
Shift+Tab |
|
Select Toggle Comment to comment/uncomment any lines that contain the selection in SQL style. |
Cmd+/ |
|
Select Clear Query to clear the query editor window. |
Cmd+. |
|
Select Format SQL to format the selected SQL or all the SQL if none is selected |
Shift+Cmd+K |
Query Execution
Icon |
Behavior |
Shortcut |
|---|---|---|
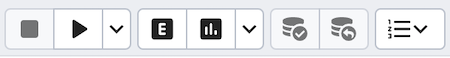
Stop |
Click the Stop icon to cancel the execution of the currently running query. |
Accesskey + Q |
Execute/Refresh |
Click the Execute/Refresh icon to either execute or refresh the query highlighted in the SQL editor panel. Click the down arrow to access other execution options:
|
F5 |
Explain |
Click the Explain icon to view an explanation plan for the current query. The result of the EXPLAIN is displayed graphically on the Explain tab of the output panel, and in text form on the Data Output tab. |
F7 |
Explain analyze |
Click the Explain analyze icon to invoke an EXPLAIN ANALYZE command on the current query. Navigate through the Explain Options menu to select options for the EXPLAIN command:
|
Shift+F7 |
Commit |
Click the Commit icon to commit the transaction. |
Shift+CTRL+M |
Rollback |
Click the Rollback icon to rollback the transaction. |
Shift+CTRL+R |
Macros |
Click the Macros icon to manage the macros. You can create, edit or clear the macros through the Manage Macros option. |
Data Editing Options
Icon |
Behavior |
Shortcut |
|---|---|---|
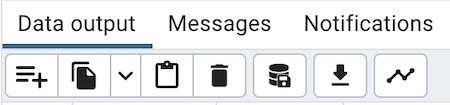
Add row |
Click the Add row icon to add a new row |
|
Copy |
Click the Copy icon to copy the content with or without header:
|
Accesskey + C |
Paste |
Click the Paste icon to paste a previously copied row into a new row. |
Accesskey + P |
Delete |
Click the Delete icon to mark the selected rows for deletion. These marked rows get deleted when you click the Save Data Changes icon. |
Accesskey + D |
Save Data Changes |
Click the Save Data Changes icon to save data changes (insert, update, or delete) in the Data Output Panel to the server. |
F6 |
Save results to file |
Click the Save results to file icon to save the result set of the current query as a delimited text file (CSV, if the field separator is set to a comma). This button will only be enabled when a query has been executed and there are results in the data grid. You can specify the CSV/TXT settings in the Preference Dialogue under SQL Editor -> CSV/TXT output. |
F8 |
Graph Visualiser |
Use the Graph Visualiser button to generate graphs of the query results. |
Status Bar

The status bar shows the following information:
Total rows: The total number of rows returned by the query.
Query complete: The time is taken by the query to complete.
Rows selected: The number of rows selected in the data output panel.
Changes staged: This information showed the number of rows added, deleted, and updated.
Ln: In the Query tab, it is the line number at which the cursor is positioned.
Col: In the Query tab, it is the column number at which the cursor is positioned